What did Earth look like when humans migrated to the Americas? Changing sea levels and large ice sheets during the last ice age played a key role in human migration and explain many archaeological sites now buried under the sea.
I wanted a better way to visualize how geography shaped our history. So I built an interactive historical model of Earth, covering the last 100,000 years. It includes elevation, rising sea levels, changing climate and moving ice sheets. And it works in your browser. In this post I will explain how I built this using multiple scientific datasets, data processing, THREE.js and shaders. Want to skip ahead? Try out the demo
Elevation map
The most important data that I need is a global elevation map of Earth. This data contains terrain height at a specific resolution. Each pixel represents a height between -8714 and 5724 meters, peaks like Everest are not included because the actual highest point is too small.
I used the ETOPO Global Relief Model from NOAA (National Centers for Environmental Information) for this. But this dataset is way more detailed than I actually need. The resolutions here are given in arc-seconds. One arc-second is 1/3600 of a degree, that’s about 30 meters at the equator. For my purposes, I only need about 180 arc-second resolution (~ 6 km), so I downloaded the 60 arc-second file and downsampled it to this size. This brings it down to an 7200x3600 pixels.
I then loaded this into Node.js using geotiff and wrote a script to compress it even further. I only need high resolution near sea level to determine the exact shoreline, so I make a custom value range for this. I compress every height value to a byte (max 256 values), by allocating 25 values for underwater, 25 for land, and the remaining 206 values for the sea level. Since sea levels only fluctuated by around 160 meters, this range is more than enough for my purposes. The result is saved to a 1 channel (no color) PNG file.
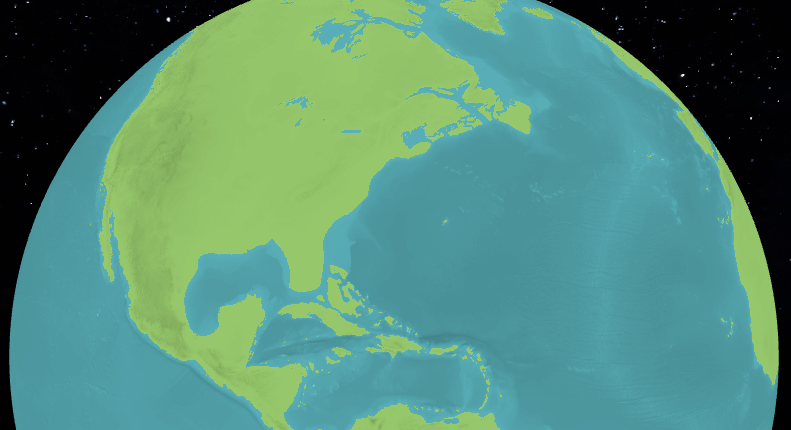
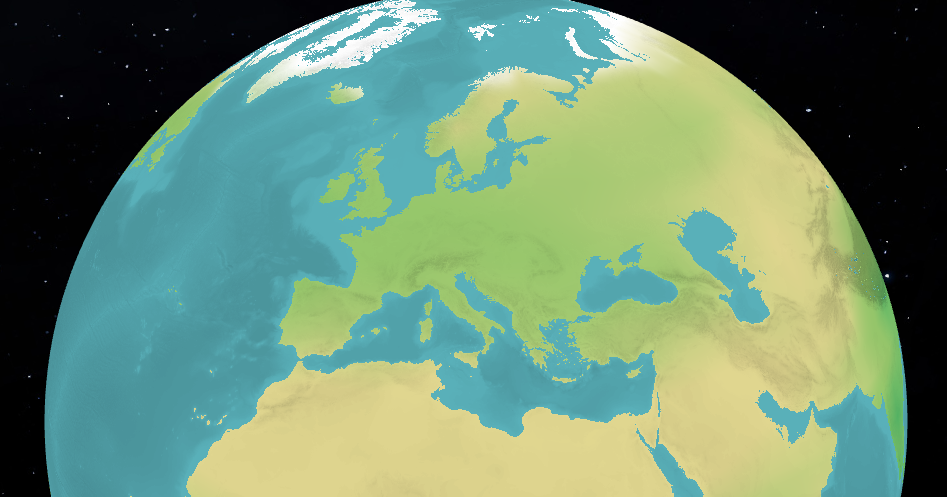
I render this using a custom shader and a sphere in THREE.js. I load the height texture and sample the color using the texture coordinate. Then I convert the grayscale value back to the height and choose either water or grass color, based on if it is below or above sea level. I also darken the output color based on the height to give the surface some texture.
Show shader code
vec4 heightColor = texture2D(heightTexture, vUv);
float heightIntensity = heightColor.r * 255.0;

float height = 0.0;

if (heightIntensity < 25.0) {
  height = -150.0 + (25.0 - heightIntensity) / 25.0 * -8714.0;
} else if (heightIntensity <= 230.0) {
  height = heightIntensity - 175.0;
} else {
  height = (heightIntensity - 230.0) / 25.0 * 5724.0;
}

if (height < sealevel) {
  float darkness = 1.0 - (height / -8714.0 * 0.25);
  outColor = waterColor * darkness;
} else {
  float darkness = 1.0 - (height / 5724.0 * 0.25);
  outColor = grassColor * darkness;
}
Historic sea levels
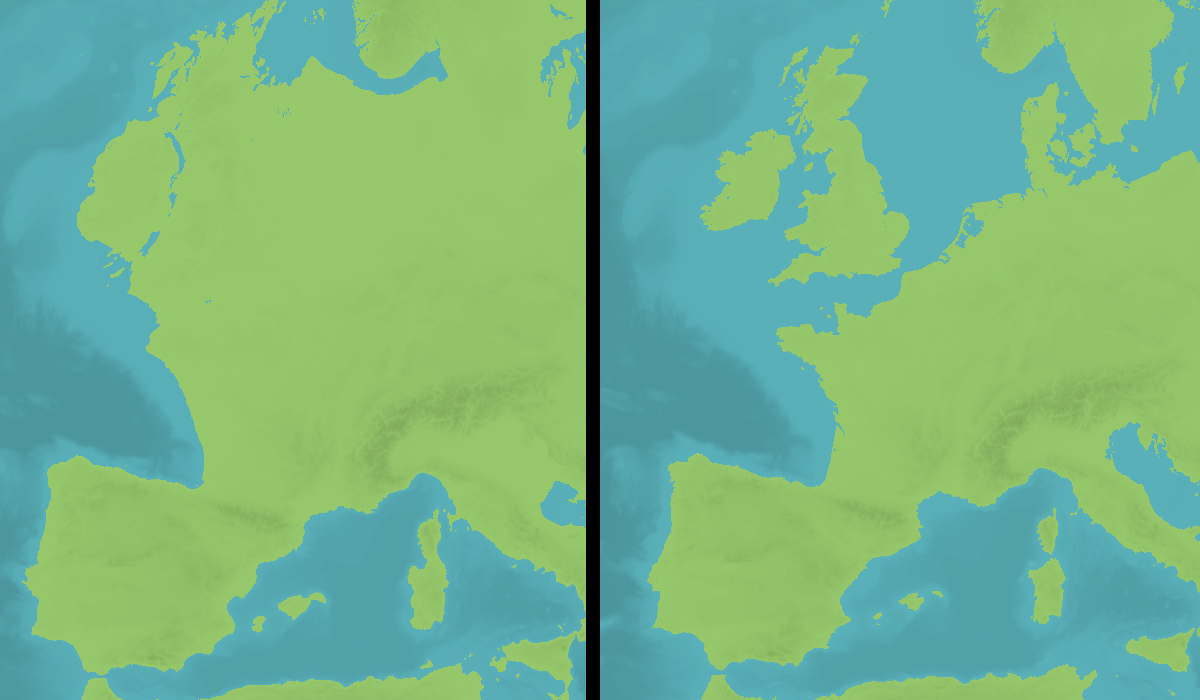
To make this interactive I will need data about historic sea levels. I downloaded the Global Sea Level Reconstruction dataset from the NOAA Paleoclimatology Program. This contains global sea levels up to 800,000 years ago. I extracted only the sea level values and stored these in a binary file. The user can now select a year, and the shader uses the corresponding sea level to draw the shoreline.
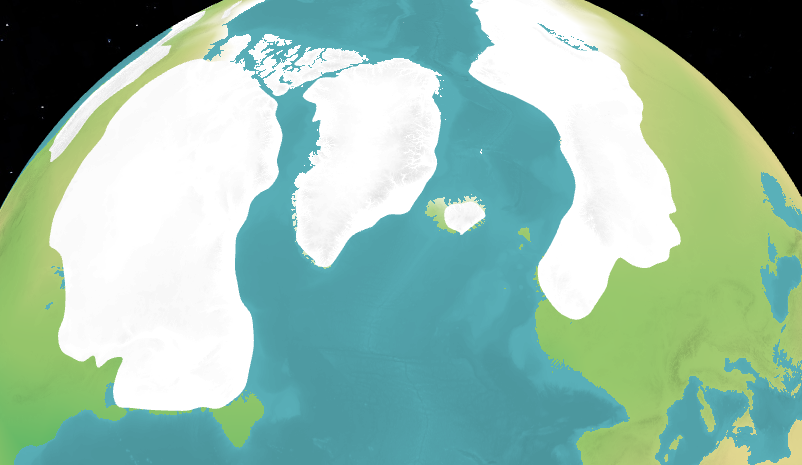
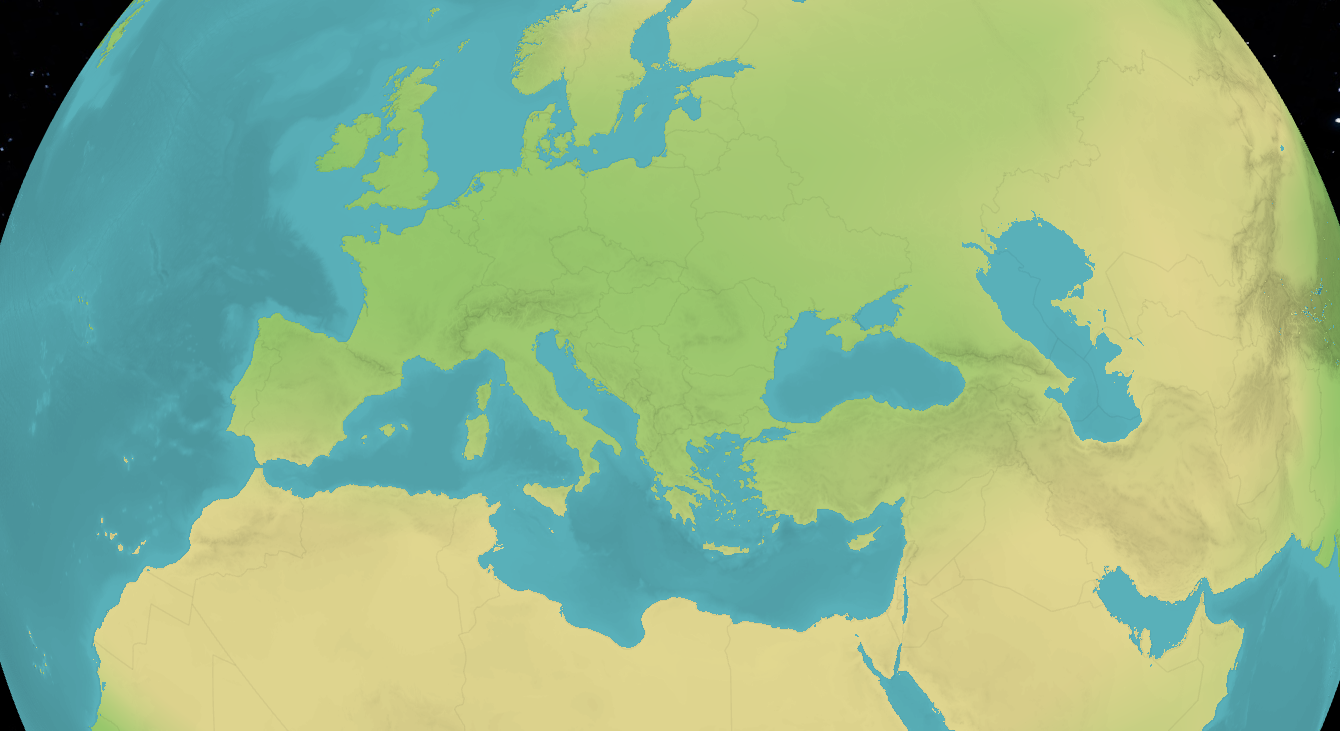
If I now switch between 15,000 years ago and the present, you can see that the area between Great Britain and mainland Europe was previously connected (see image below). This area is called Doggerland and fishermen still dredge up bone tools and mammoth tusks from there. Another interesting area is the Bering Strait. This gap between Russia and Alaska used to be land, and it facilitated the movement of early humans from Asia to the Americas.
Climate data
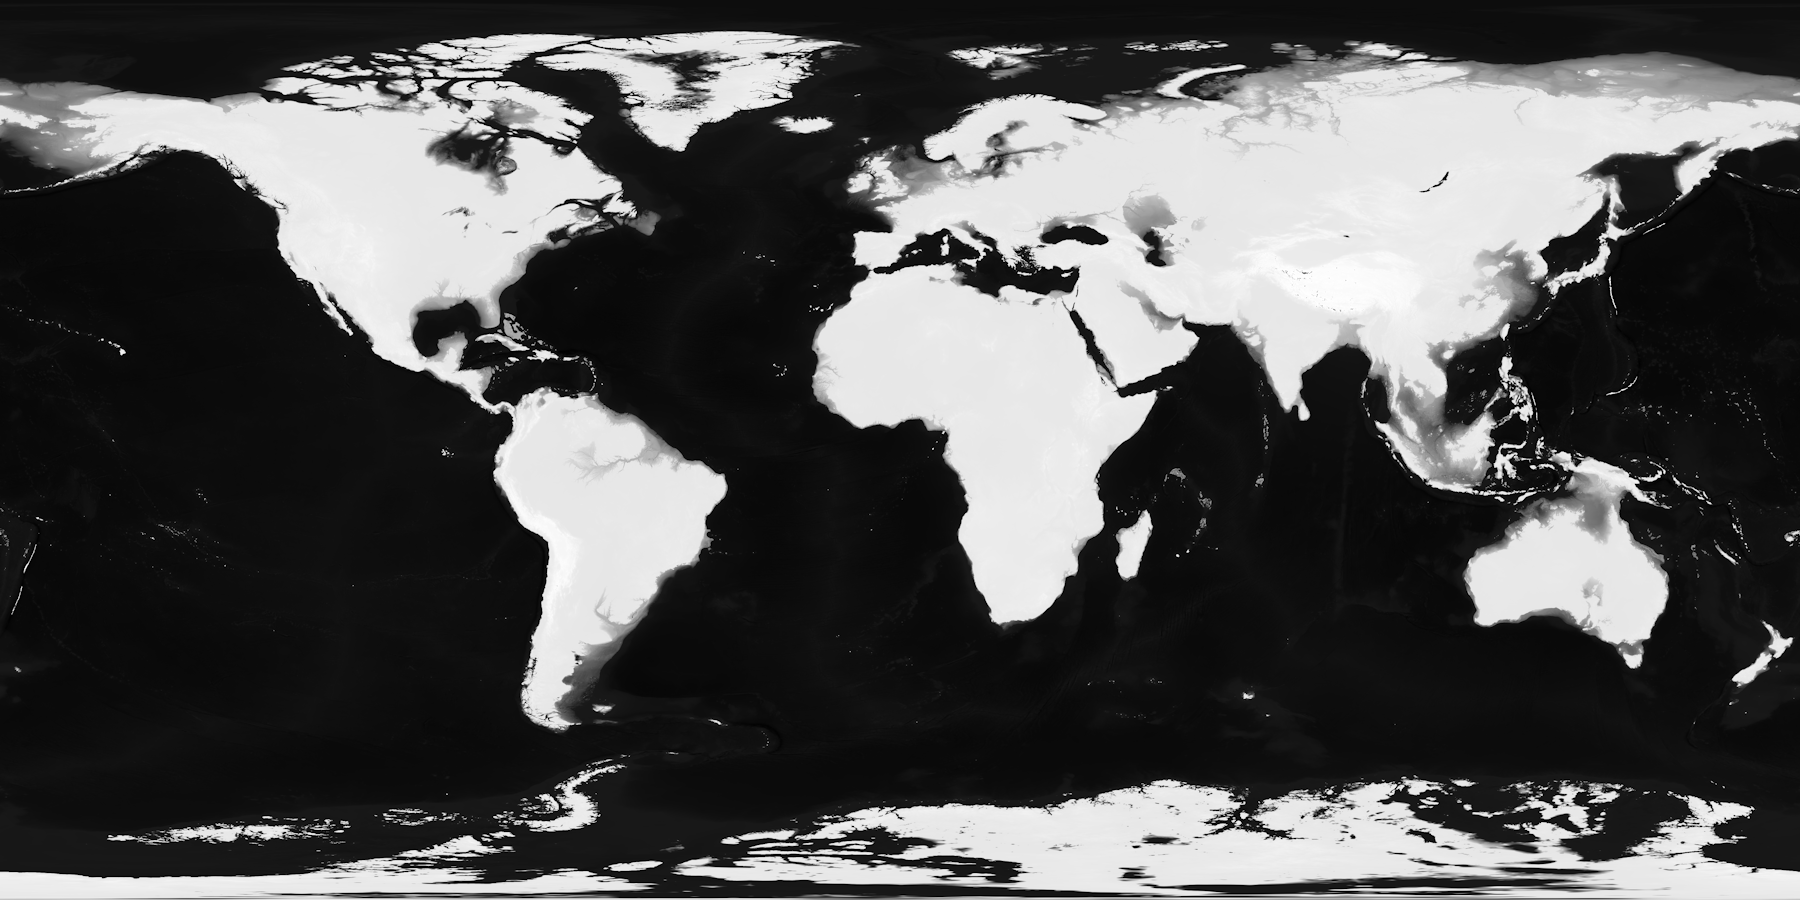
Now, I have an interactive globe, but everything is still either green or blue. To add some more color I need information about the climate, like rainfall and temperature. Luckily, there’s a dataset that contains simulated climate data up to 3 million years ago. You can see an example of daily average rainfall below:
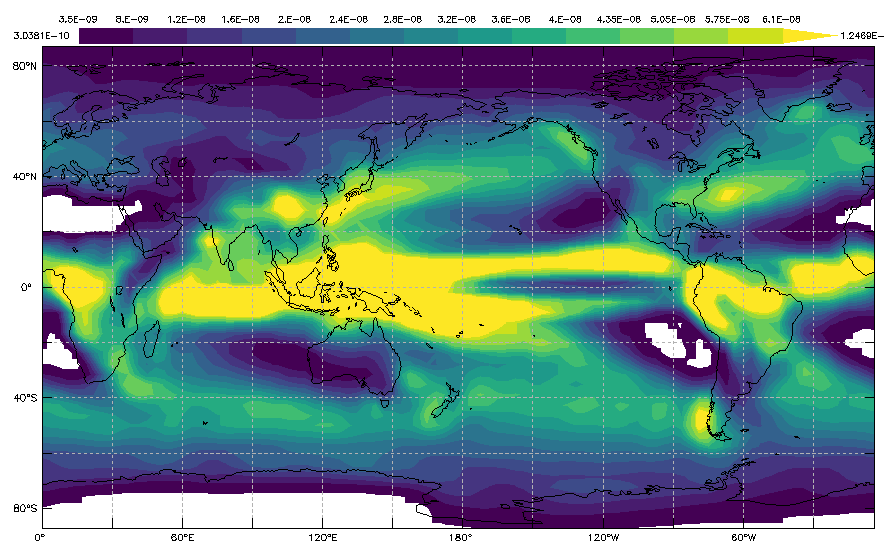
I collected all rainfall and temperature data from the past 100,000 years and compressed it into a 1.2 MB file. I load the data into the GPU using a sampler2DArray. This is basically a stack of textures, where each layer in the stack is a specific year. Each pixel in a texture contains red, green and blue values, which I used to encode for minimum and maximum temperature, and rainfall. By sampling this texture, you sample both over time and over location. So if the current view year is between two layers, it will average the values.
I then wrote some code to choose the render color based on these values, and a function to smoothly transition between different colors so there are no hard edges. For example, when the temperature is high and the rainfall is low, it’s desert. But if the rainfall is high, it’s rendered as forest. With some tweaking, this worked surprisingly well for my purposes.
Show shader code
vec3 slideColor(vec3 from, vec3 to, float value, float low, float high) {
  float ratio = (value - low) / (high - low);
  return mix(from, to, ratio);
}

vec3 color = slideColor(
  slideColor(
    snowColor,
    slideColor(desertColor, grassColor, precipitation, 250.0, 500.0),
    maxTemp, 5.0, 10.0
  ),
  slideColor(
    slideColor(desertColor, grassColor, precipitation, 400.0, 1000.0),
    slideColor(grassColor, forestColor, precipitation, 1000.0, 2000.0),
    precipitation, 200.0, 1000.0
  ),
  maxTemp, 0.0, 10.0
);
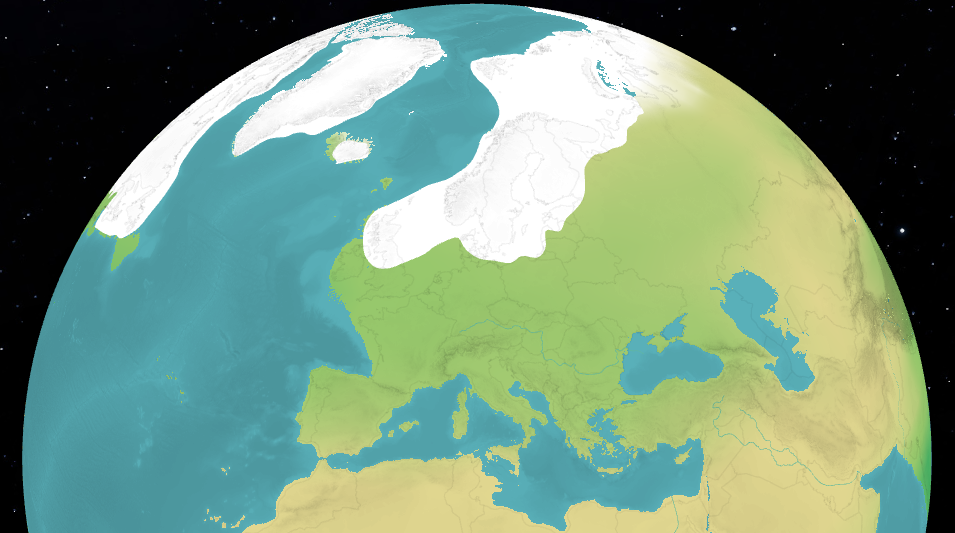
Ice sheets
The last ice age ended about 12,000 years ago and had a big impact on early human settlement. I will need accurate data about the historical locations of ice sheets to visualize this on the globe. I ended up using the Global ice sheet reconstruction for the past 80000 years dataset. This is the most accurate and highest resolution dataset I could find, with a 0.25 degree grid and 2500 year time steps.
This dataset is in NetCDF format, a scientific data format, which I parsed using netcdf4. It contains ice thickness data, but for my purposes it’s enough to know if there is an ice sheet or not.
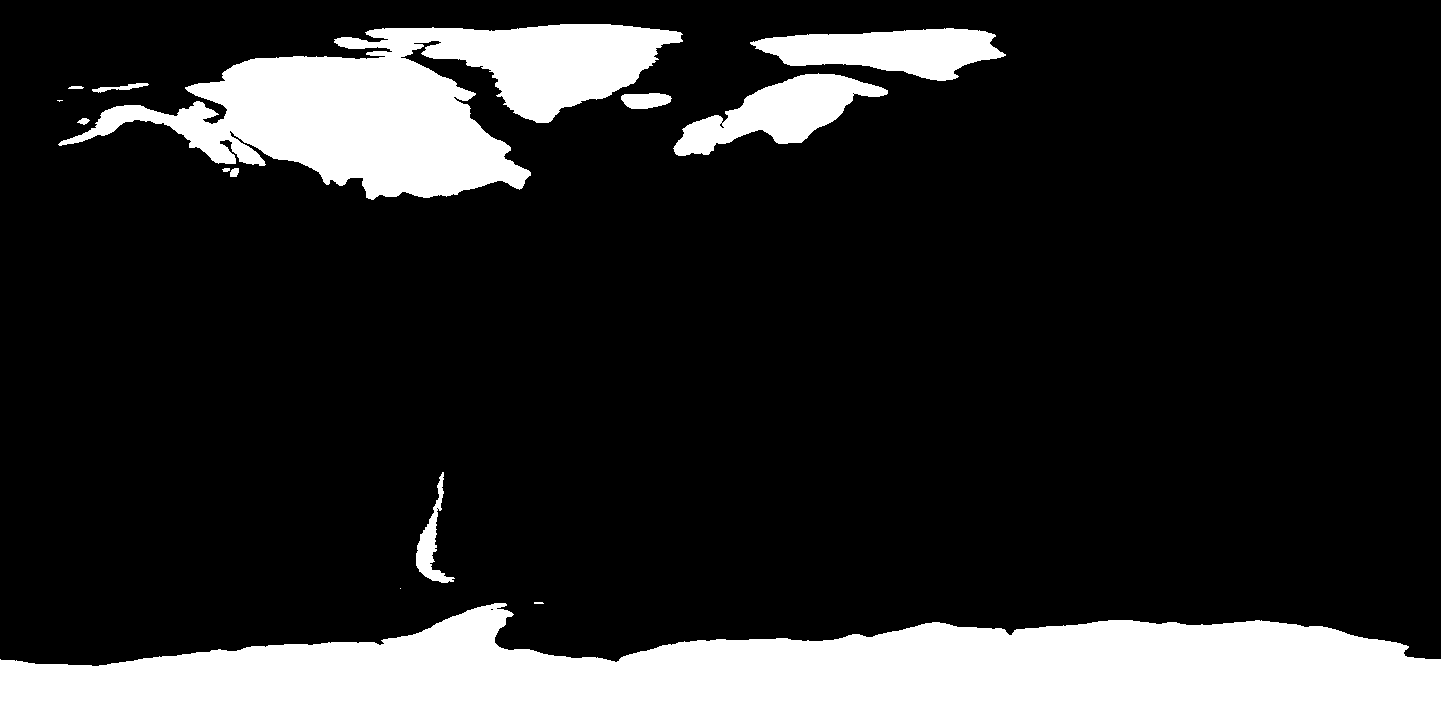
To render this efficiently with a GPU, I need to somehow transform this into triangles. I can’t just use a texture because of data constraints, and even a very large texture would look ugly when zoomed in. I did the triangulation in multiple steps. First, I find all individual “islands” of ice using a flood fill algorithm. Then I find the edges of each island and turn them into coordinate lists. Next, I run a smoothing step to smooth out the edges and optimize the number of points needed.

I then add points at regular intervals over the surface of the each “island” shape (red points in the image below). After that I use Delaunay triangulation to turn this into triangles by efficiently creating edges between the points. You can see the result of this below:
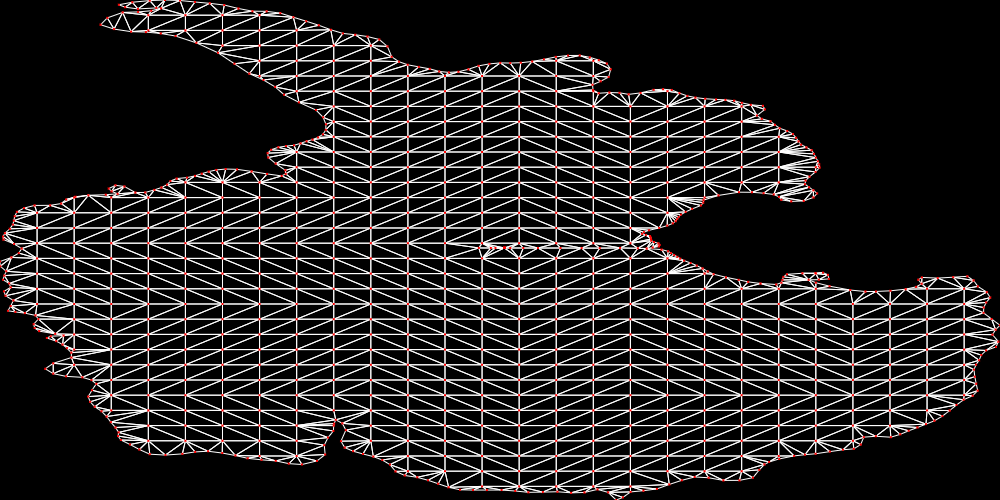
Then I project these flat points onto the globe and render these shapes using THREE.js. The added points across the surface of the shape are essential to ensure a smooth curvature. The shader also darkens higher elevations to give some texture to the ice sheets.
Borders
Lastly I wanted to add modern country borders to make it easier to understand where certain features are located. I used the World Administrative Boundaries - Countries and Territories for this. This dataset stores the coordinates of all borders between different countries.
I used the same smoothing algorithm from before to smooth the jagged edges and reduce the number of points. This was then rendered on top of the globe using THREE.js lines.
Demo
This project taught me a lot about geography, data processing and working with graphics shaders in the browser. You can check out the live demo here. And also in the video below:
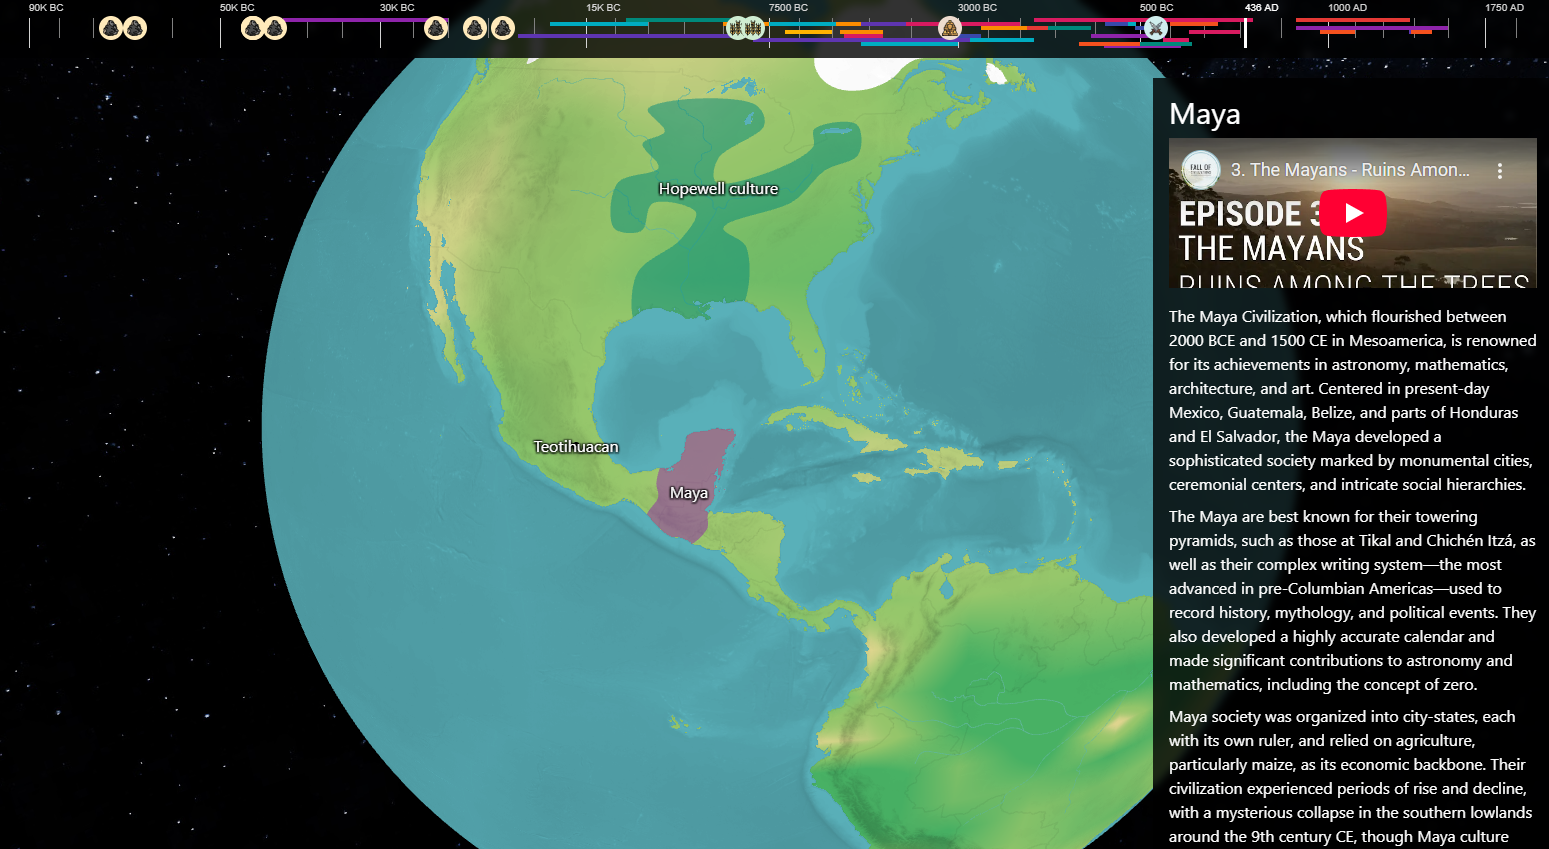
My next steps are to look at finding more accurate data, or datasets that go further back in time. And optimize the rendering. I would also like to display historical events like human migration, early civilisations, and wars on the globe. I already made a start, but it needs more work. If this kind of project excites you, follow along on GitHub or reach out me via LinkedIn.
Discuss on Hacker News